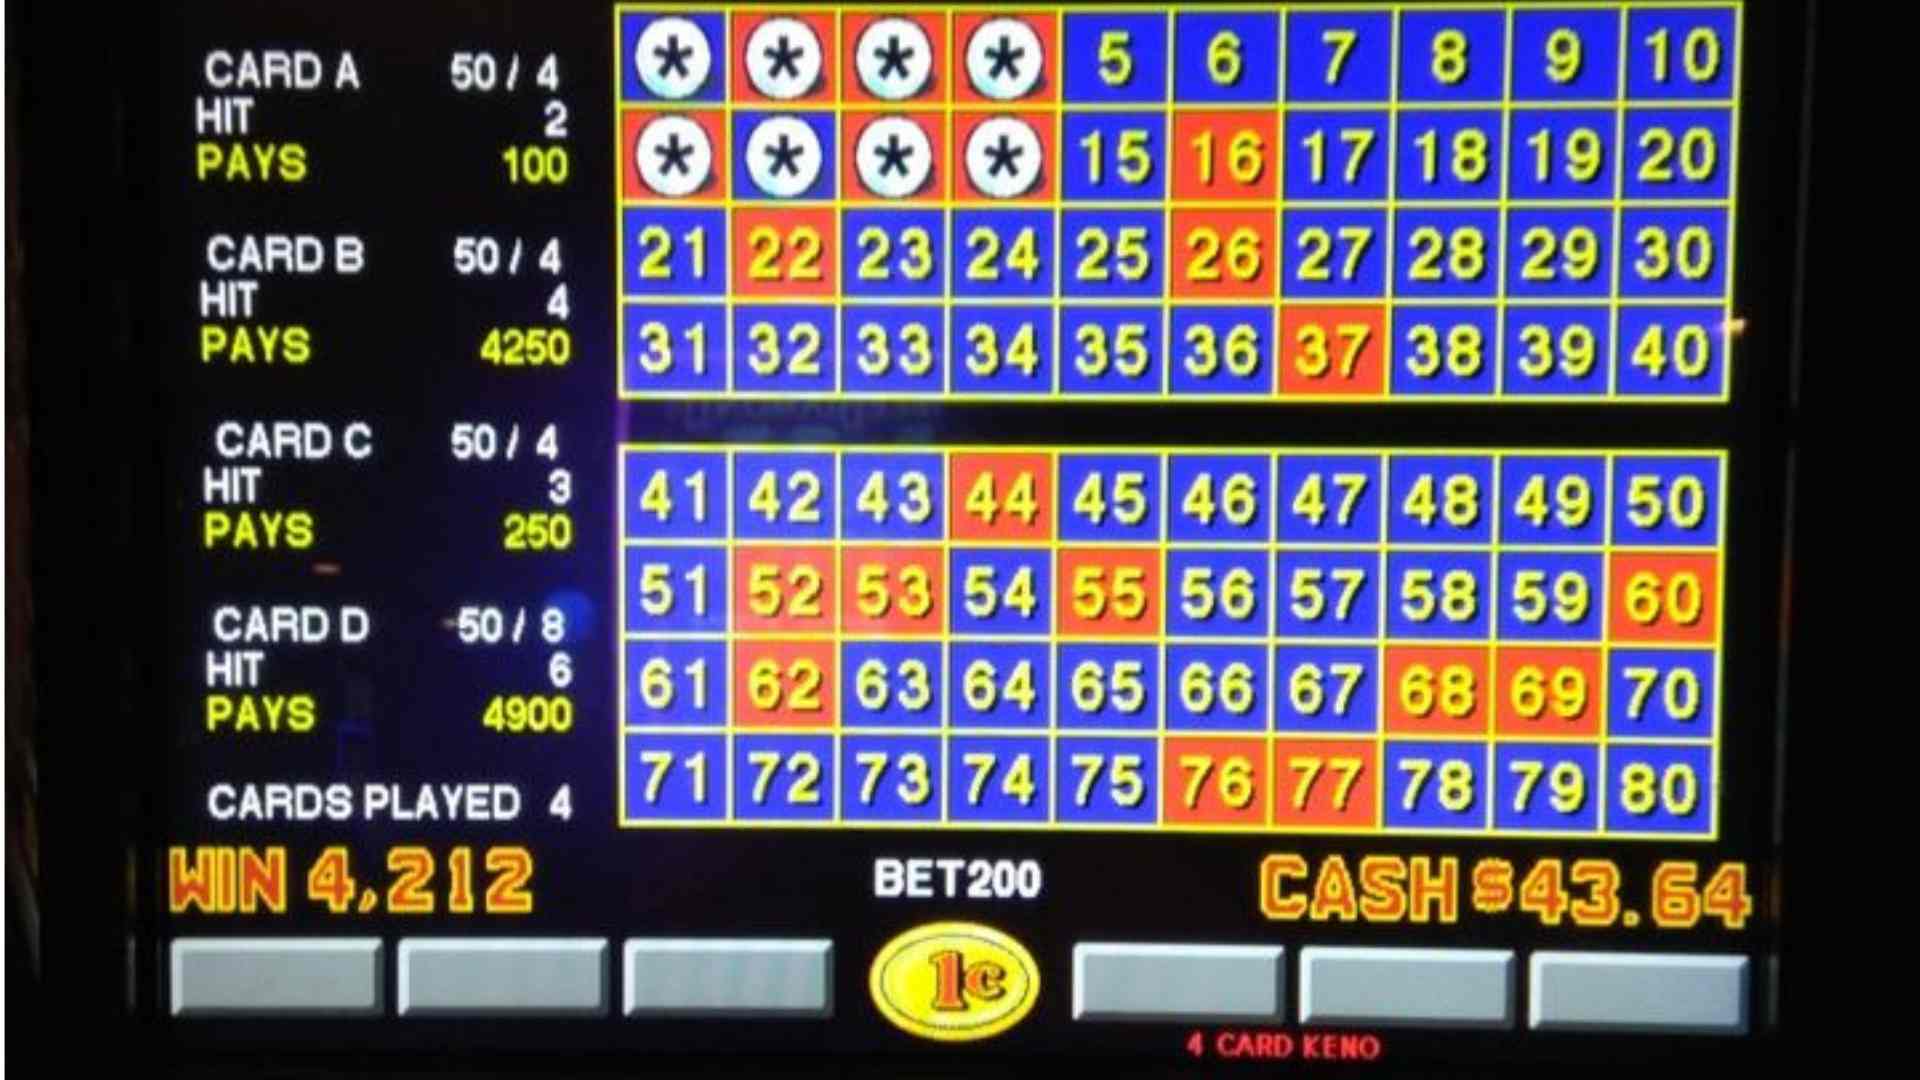
Lottery games capture the imagination of millions around the world, largely due to the life-changing jackpots advertised on giant billboards and news headlines. However, behind these massive financial figures lies a complex mathematical structure that dictates the exact likelihood of matching every drawn digit. Understanding what these numerical probabilities actually signify can help participants maintain a balanced perspective on their chances.
The Mathematical Reality Behind Massive Jackpot Odds
When evaluating major national lotteries, the odds of taking home the grand prize often sit around 1 in 300 million. This statistical probability is calculated using combinatorial mathematics, which determines every possible variation of number sets drawn from a specific pool. Because every single ticket possesses the exact same mathematical probability, purchasing additional entries improves your overall chances only marginally.
Visualizing such astronomical numbers can be difficult for the human brain to process intuitively. For instance, a probability of 1 in 292 million is comparable to picking a single specific grain of sand out of a large swimming pool filled entirely with sand. Recognizing this scale allows individuals to view ticket purchases as entertainment rather than a reliable investment strategy.
Understanding Lower Tier Prizes and Overall Win Rates
While headlines focus almost exclusively on the top-tier jackpot, most lottery systems feature multiple secondary prize tiers. Matching fewer numbers yields smaller, fixed payouts that occur with significantly higher frequency than the jackpot itself. The overall odds of winning any prize on a ticket are typically much better, often ranging between 1 in 25 and 1 in 40 depending on the specific game rules.
These secondary tiers are essential for maintaining player engagement and redistributing a portion of ticket sales back to participants. Many gaming enthusiasts also explore probability metrics across different wagering platforms, such as m88, to understand how various games structure their risk and potential returns. Examining these lower-tier odds provides a more complete picture of what a ticket actually offers.
How Ticket Volume and Rollovers Impact Expected Value
As a jackpot rolls over and grows larger, public participation increases dramatically across the country. Higher sales volumes generate bigger prize pools, but they also significantly raise the likelihood of multiple players holding matching winning numbers. When a grand prize is shared among multiple winners, the actual payout per individual decreases accordingly.
In financial statistics, expected value measures the average return a player can anticipate per dollar spent over time. Even when a massive jackpot pushes the mathematical expected value of a ticket close to positive territory, factors such as taxes and shared jackpots pull the real expected return back down. Understanding this dynamic helps explain why astronomical prize values rarely translate to favorable long-term odds.
Maintaining Responsible Play with Clear Expectations
Participating in lottery games should always be approached as a form of casual entertainment rather than a path to financial growth. Setting strict budgets for gaming activities ensures that discretionary spending remains within safe limits. Recognizing that every draw is entirely independent prevents common misconceptions like assuming past numbers affect future results.
Ultimately, demystifying lottery statistics empowers players to make informed decisions without falling prey to unrealistic expectations. By understanding the true meaning of combinatorial odds, individuals can enjoy the excitement of the draw responsibly while keeping the actual figures in proper context.